


6 Steps to Profitable Swing Trading
Part 5.1: Position Entry Tactics

Where did we leave off? So we have the right market, the right stocks, and the correct setup - those are the easy parts of trading. We haven’t actually done anything yet. We haven’t put real money at risk. This is where the rubber meets the road - executing and managing trades. This is where the best-laid plans go to die by well-intentioned traders once the P/L starts ebbing and flowing and their psychology gets in the way.
Before I get into the meat and potatoes of entry tactics, I’m going to start off with a few pattern models. Study them and burn them into your brain. Imagine, as a stock is building day by day, what it would need to do to look like these patterns. If your charting service can do replays, back up to recent patterns and go bar by bar and understand what stocks look like before, during, and after these kinds of setups. Tradingview is free; you can click and drag the chart back and forth and watch how things unfold. You don’t even need to pay for the replay, if you’re cheap like me.
Minervini’s VCP model:
The Victor Sporandeo trendline break:

Professional Trading Strategies core bull patterns:
One thing you’ll notice with these model patterns is that they all have higher lows and a pivot breakout. Waiting for a higher low to form is one of the most basic tenants of trend. The first step in higher lows and higher highs (the literal definition of an uptrend) is higher lows. Furthermore, once the stock breaks out above point 2, you now create a higher high, thus confirming the new trend. Outside of the EMA cross-back, the higher low, 1-2-3 buy is a fundamental component of most solid continuation patterns:

How do you put a trade plan together using this information? I’m glad you asked. All of these setups have three critical components you need in place for every trade:
Entry
Stop-loss
Trade Management
Entry Tactics - Ready, Aim, Fire
A setup is just that - a setup. Setup does not equal entry. That is one thing I want to make clear. Before getting involved, you need a trigger - the specific event that will get you into the trade. If I had a dollar for every 5-star setup that didn’t clear the pivot or trigger a breakout, I’d have a lot of dollars. This is why we wait for a pivot or level to form AND wait for a triggering event before initiating the trade.
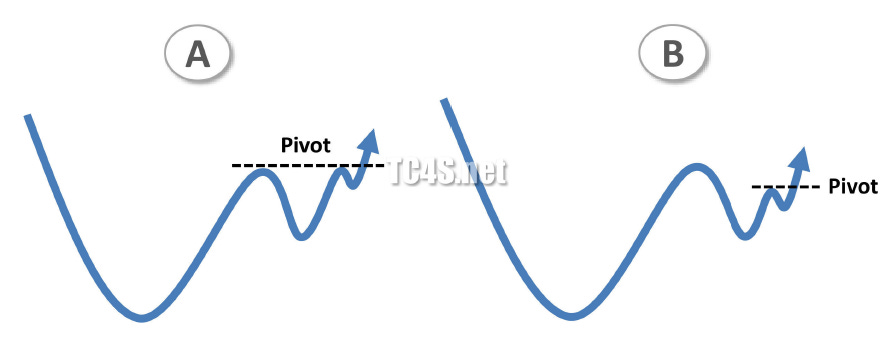
In all likelihood, the specific trigger you use will be directly related to the pattern you are trading. In the case of the higher-low patterns we’ve discussed, the trigger is a price break above the pivot. In most cases, the pivot will be a clustering or range of 3-5 days - a group of tight, narrow-ranged bars that feel like the pause before a great leap. It looks a little something like:

Put together, you have something like the above. As a pattern unfolds, the most recent high and low will often change. Ideally, you want the highs (point 2) to get lower or stay the same and the lows (point 3) to get higher - or at least stay the same. This means your pivot (point 2), or action point, can change.
Stockbee talks about what happens before the stock breaks above point 2 and during the trigger bar here:
The day prior to range expansion day will be narrow range day or negative day
The stock will have 3 to 20 days consolidation prior to range expansion day
The stock will have series of narrow range days prior to breakout
On breakout day volume is higher than previous day
On breakout day stock closes at or near its high for the day (preferred)
Stock up 4% or more, indicating a significant move
Ivanhoff looks for:
Tight side-ways consolidation on below average volume, lasting anywhere between 2 and 20 trading days. 5.
The closing prices of the past few trading days are very near to each other.
Stock is coiled near its 5, 10 or 20-day moving average.
A 2% gain from the open to a new 10-day high is a significant move when it comes from an area of low-volume consolidation. Many range expansion trends begin with it.
Another version of the breakout setup is to use 4% move without the 10-day high requirement. 4% is a significant move for most stocks priced above $10.
Kristjan looks for:
An orderly pullback and consolidation with higher lows and tightening range in the consolidation phase.
A range expansion (breakout) out of that consolidation. The consolidation phase is usually 2 weeks to 2 months. During the consolidation the stock price “surfs” the rising 10- and 20-day. and sometimes toe 50-day moving average.
Enter on the opening range highs. The opening range highs can be the highs of the first 1-minute candle, the 5-minute candle or the first 30-minute candle. You can use whatever timeframe or a combination of them. You don’t even have to use any intraday chart, just look at the daily chart and enter when the stock is starting to break out. This method can also be traded by anticipating the breakout but I don’t find it as effective and more skill and experience is needed.
Why do I point out all of these seemingly different contexts and trigger methods? Isn’t that confusing? Well, actually, if you look at all three methods, there is a LOT of overlap and convergence. The key points are:
Tight, orderly action before the breakout
An expansion of range on the breakout ABOVE the tight action
Often accompanies an expansion of volume as well
The main differences are not in the context immediately preceding the breakout - they seem to be in violent agreement regarding the preference for tight, orderly action before the breakout. The bigger differences on the thresholds for what constitutes a “breakout”.
The key takeaway is to make sure the stock gives you a tight, orderly pivot area and wait for some level of confirmation that the stock is, in fact, breaking out above the pivot, whether you use 2%, 4%, or eyeball the chart to make sure it’s breaking out, as Kris recommends.
Quantifying Volatility
As an aside, let me geek out for a moment. One of my main issues with the above parameters is they are very generic and subjective. One can think that 2 or 4% constitutes a “significant” move, but to divorce that value from the stock’s own average daily range never made sense to me. If a stock moves around 8% daily, how is 2 or 4% significant? That would barely constitute noise in the stock’s average daily fluctuations.
Also, what the fuck does “tight and orderly” even mean? How do I scan for that? How do I remove my subjective bias to assess stocks with some common framework?
For my own sanity as an engineer I attempted to quantify and relate these threshold descriptions not only to the stock’s own volatility, but the volatility of the contraction and expansion that makes up good setups. There is a common market phenomenon known as volatility expansion and contraction. The idea is that stocks go through phases of expansion and contraction. Breathing in and breathing out.
The more I thought about the descriptions these great traders gave above for their setups, I realized that’s exactly what they are describing - the contraction (which builds the tight pivot area) and the expansion (which is the breakout from that pivot). Eureeka! I could now build scans identifying these phenomena based on very scannable criteria.
For instance, let’s say the stock’s 20-day ADR is 10%, meaning on average, the stock has fluctuations from high to low by 10%.
For any “tight and orderly” consolidation, at a minimum, one would expect for a stock to be contracting, it’s average range would be LESS than 10%, ideally much less. If the stock trades tight for 3-5 days by only fluctuating, say, 5-8% on average, that is by definition tighter than it’s normal average fluctuations. I can scan for that. Could I do that with my eyeball? Sure, I guess, but again, I want to remove subjectivity and be able to scan for things somewhat mechanically.
For the breakout threshold, at a minimum, one would assume to be expanding, the breakout would have to be greater in volatility, or bigger, than the contraction’s volatility and range. Again, if the consolidation has compressed down to 5% over the last 3 days, for example, then I want the breakout threshold to be greater than that amount. In fact, I want the breakout bar to be the biggest, greeniest bar in the last 5-10 days. This shows conviction, power, EXPANSION out of the range it was just in.
So in a nutshell, I want to relate the concepts of contraction and expansion to the stock’s own volatility. In that way, I can baseline a stock’s movements against itself without resorting to overly generic terms.
Visualizing Volatility
One useful way I go about doing what I described above was by using color bars and bollingerband width in TC2000. Below is my chart setup. On the left, I have the daily timeframe and on the right I have the hourly with the 20-period BBW. Using color bars function, I can “see” volatility expansion and contraction through the way I have the colors setup. Green bars are expansions of volatility, whereby they are the biggest bars in the last 5 sessions. Purple bars are contractions in volatility, where the average of the last 3 sessions are trading at less than the average volatility.

This compression pattern is more clearly seen on the right side with the hourly BBW. For reference, since there are 19.5 hourly bars in three sessions and the hourly BBW is using the last 20 bars, then this essentially equates to 3 days worth of price action. While the stock’s daily ADR was around 16% at the time, intraday, the avg of the last three days compressed down to 9% - now that’s significant contraction of range. When BBAI 0.00%↑ popped out of that compression pattern by breaking the upper bollinger band on the 24th, I was all over it.
To top it off, I was able to get a 6% stoploss on a stock that normally averages nearly triple that amount. I let the stock’s own volatility, based on the BBW bands, tell me when it is breaking out - rather than using subjective percentages or ORHs. That's how you get asymmetrical trades - you wait for compression in a very frisky stock, then jump on board when it looks like it's expanding out to continue it's move. Compression. Expansion. Breath in. Breath out.
Anticipation vs Confirmation
Finally, regarding the breakout, there’s the concept of anticipation vs confirmation, both regarding price and volume. This means - do I wait for all of the criteria of the trigger to be actually met? Or do I anticipate that it will and “buy early”. For example, if the stock crosses the pivot line and hasn’t quite “expanded” yet relative to recent bars, do I still take it? If the volume hasn’t quite confirmed by trading above average, do I take the trade?
For example, many insist that the volume on the breakout be much heavier than usual, implying strong demand as the stock moves through that level. Other traders, such as Minervini, dismiss the value of strong volume confirmation. In fact, let’s hear from Dan and Mark, while they debate it out:
Dan Zanger: "Volume is the key to technical analysis. Without volume, the price movements don't have any real significance. When I see a breakout, I want to see volume confirmation. If the breakout occurs on light volume, it's likely to fail."
Mark Minervini: "While volume can be useful in confirming a breakout, it's not the only factor to consider. The price action itself is what matters most. A breakout on light volume can still be valid if the price action is strong enough."
Dan Zanger: "But without volume, how can you be sure that the breakout is real? A breakout on light volume is often a sign of a false breakout, and traders who rely solely on price action are likely to get burned."
Mark Minervini: "I agree that volume can be a useful confirmation tool, but it's not always necessary. Sometimes a breakout occurs on light volume because there aren't enough sellers to keep the price down. In those cases, the breakout can still be valid without strong volume."
Dan Zanger: "I understand your point, but in my experience, volume is always a critical factor. It's better to be safe than sorry, and I don't want to take any chances with a breakout that doesn't have strong volume confirmation."
Mark Minervini: "I respect your approach, but I think there's room for different strategies in the market. At the end of the day, what matters most is finding a strategy that works for you and sticking with it."
So now that that’s settled, at the end of the day, most top traders like some volume confirmation. Maybe it just makes them feel more comfortable with taking the trade, though the jury is still out on whether it matters or not for getting into solid trades.
Personally, I don’t like to anticipate, whether with price or volume. As Kristjan said earlier, anticipating takes much more skill and, likely, the right kind of market. Otherwise, you just end up in many trades that didn’t go how you thought they would. Yes, you “pay up” for confirmation, but paying up tends to be less expensive than taking a bunch of unnecessary losses. I let the scans tell me where to focus my attention by alerting me which stocks are expanding in both price and volume from a contraction zone. Yes, I still have to do some manual quality assurance to ensure the stock coming through the scan meets what my experience says is a good setup with a good breakout.
Practical Application
Make sure you have a good market backdrop with positive breadth and constructive action in the indices.
Narrow your pool of stocks down to the friskiest stocks with the most potential
Out of that pool, look for constructive patterns - refer back if you forgot.
Once you isolate the best patterns, wait for a tight pivot area of at least 3-5 days where the stock contracts significantly in relation to it’s normal movements. You can do this visually or use tools to quantify it, as I explained above.
Wait for a breakout or expansion out of that contraction area. Preferably, you want the breakout bar to be the biggest, greeniest bar in the last 5-10 days. If you don’t want to pay up for confirmation, then anticipate, but based on experience, there are trade-offs to this. Trying both ways, I’ve come to prefer paying the insurance.
Wrapping it up
There you have it. Ready, Aim, Fire. Man, that was a mouthful. I thought this would be a 6-part series, but it wasn’t until I started putting my thoughts down that I realized I’ll need to break step 5 into segments. Next, for Part 5.2, I’ll discuss trade stop-loss placement, followed by 5.3 for trade management.
Stay Tuned!!